


Vacation homes—also referred to as second homes or seasonal properties—are residential properties purchased primarily for leisure use rather than as a primary residence. While often associated with affluent buyers and resort destinations, this segment of the housing market can serve as a leading indicator of broader economic conditions. Because these purchases are typically discretionary, shifts in vacation-home demand can signal changes in consumer confidence, housing affordability, and the financial flexibility of higher-income households—factors that also influence the wider real estate market and local economies that depend on seasonal residents.
In recent years, higher mortgage rates, elevated home prices, and tighter financial conditions have made second-home purchases more difficult to sustain, particularly compared with the low-rate environment earlier in the decade. As a result, many prospective buyers are turning toward alternatives such as timeshares and short-term rentals, which offer access to vacation properties without the high upfront costs and unpredictable overhead of owning a vacation home.
To better understand these shifting conditions and their effects, SellMyTimeshareNow—a global marketplace where people around the world connect to rent, buy, and sell timeshares—analyzed where the decline in vacation home purchasing is occurring, to what extent, and how the timeshare market is responding.
Here are the key takeaways from the analysis:
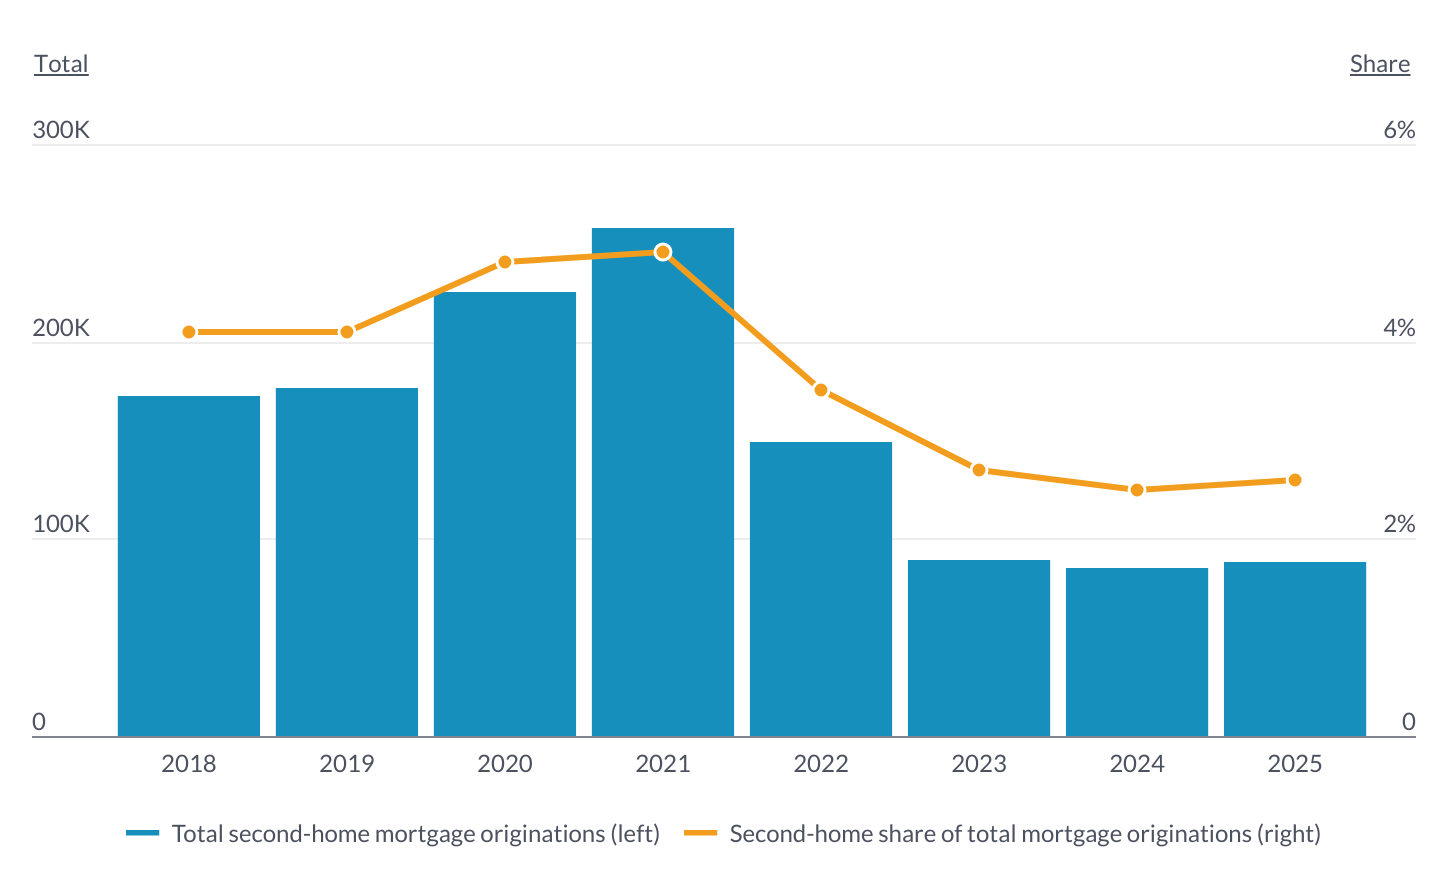
- Vacation-home purchases fell 65.8% from their 2021 peak. U.S. second-home mortgage originations dropped from 257,549 in 2021 to 88,158 in 2025, while the second-home share of all mortgage originations also fell from 4.9% to 2.6% over the same period.
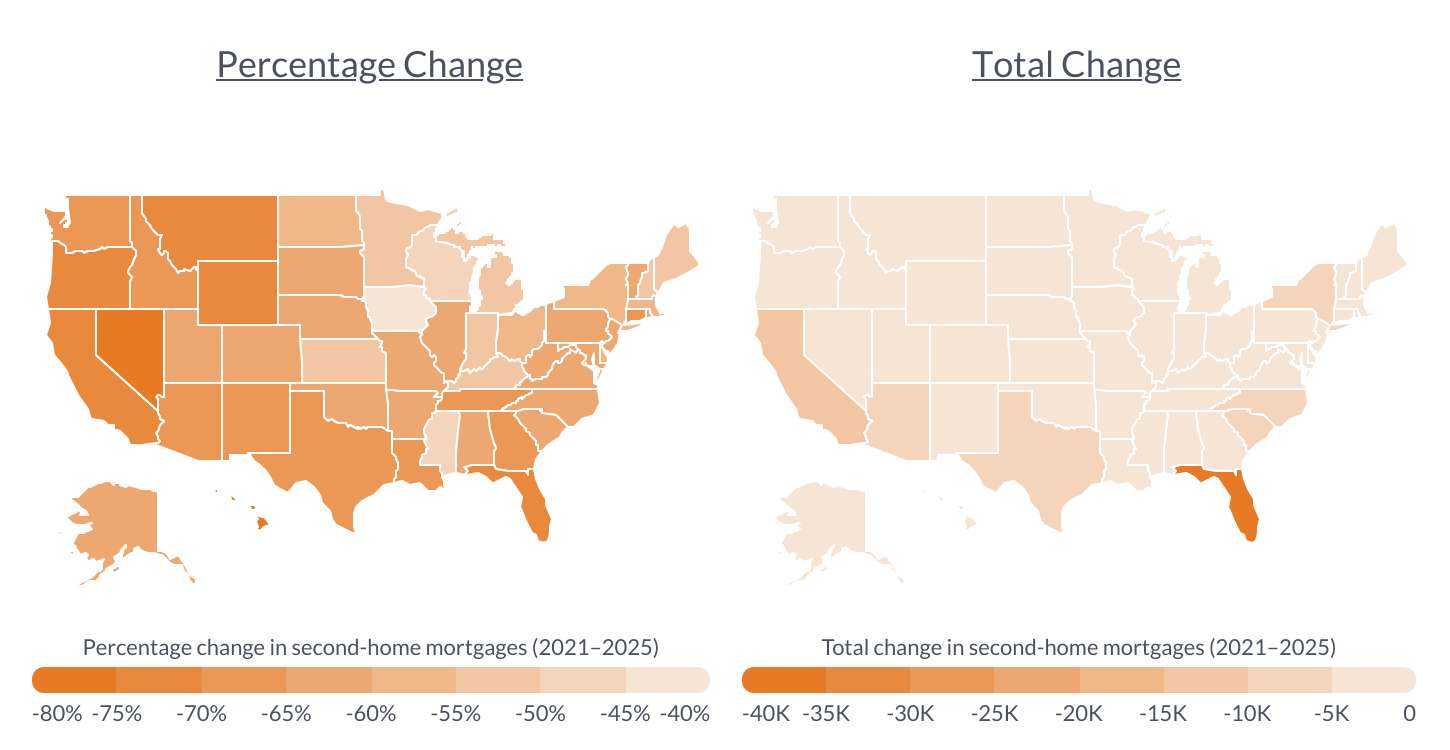
- Florida saw the biggest drop in total vacation-home purchases. Between 2021 and 2025, Florida recorded 38,465 fewer vacation-home purchases with a mortgage, more than any other state. By percentage, Nevada saw the largest decline at 78.3%, followed by Hawaii (-77.8%) and Wyoming (-74.5%).
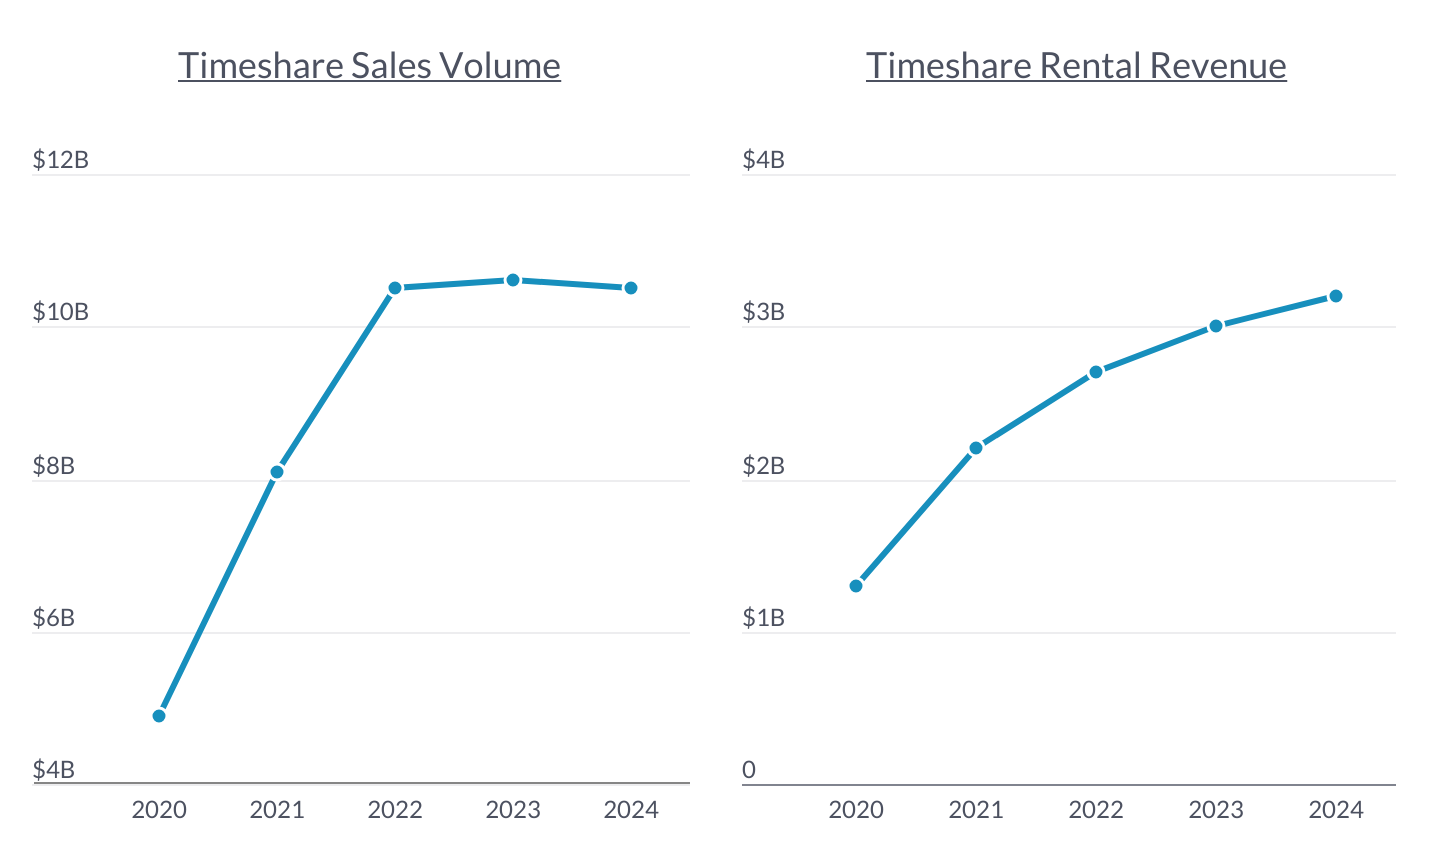
- The U.S. timeshare industry expanded since pandemic-era lows. U.S. timeshare sales volume rose from $4.9 billion in 2020 to $10.5 billion in 2024, while rental revenue climbed from $1.3 billion to $3.2 billion. That amounts to gains of 114.3% and 146.2%, respectively.
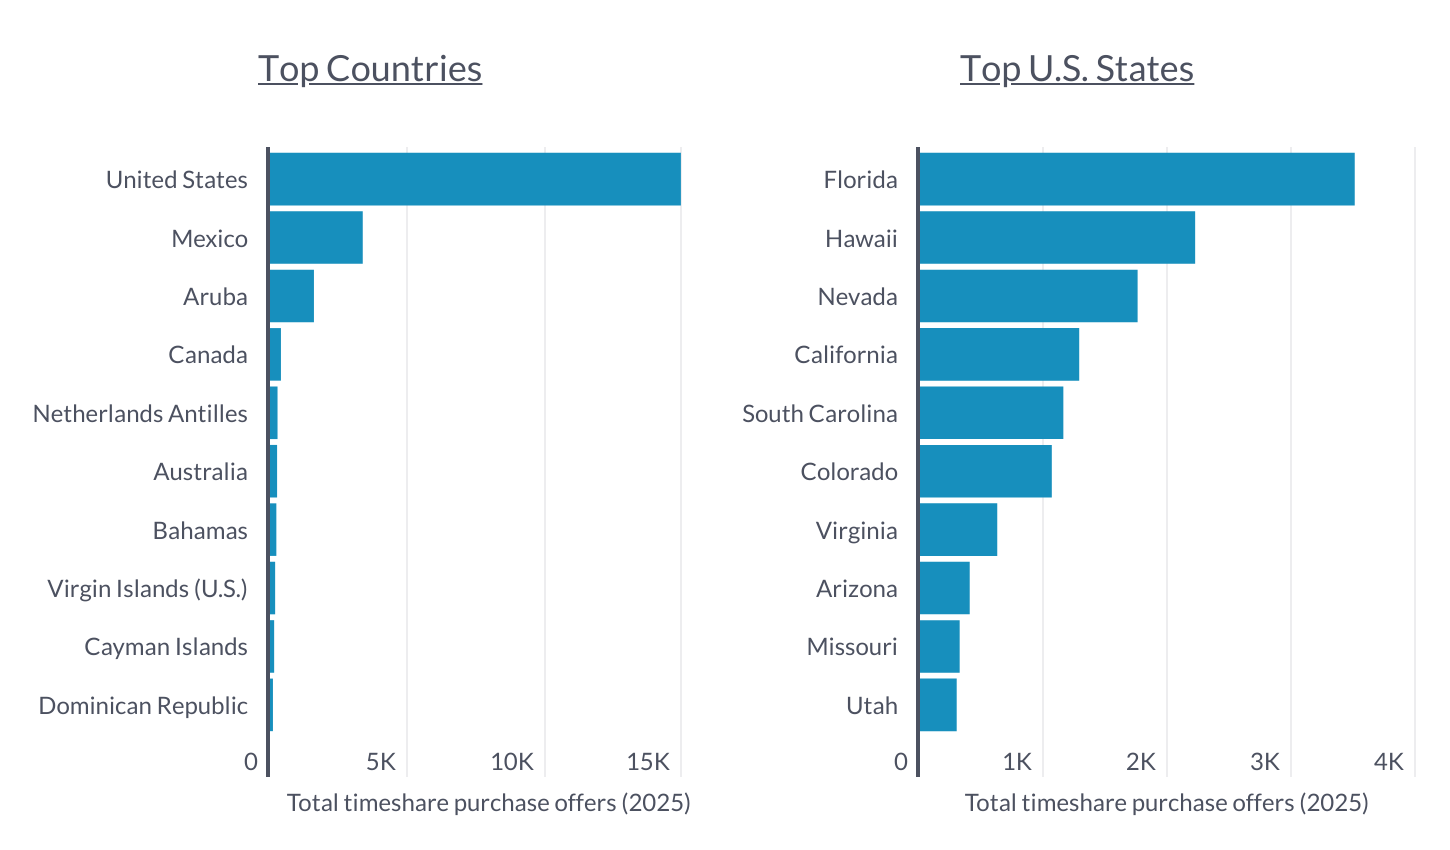
- Timeshare purchase interest in 2025 was heavily concentrated. On the SellMyTimeshareNow marketplace, the U.S. led with 14,942 purchase offers, far ahead of Mexico (3,373) and Aruba (1,598). Within the U.S., Florida ranked first with 3,506 offers, followed by Hawaii (2,219) and Nevada (1,755).
Trends in Vacation Home Purchases Over Time
Vacation home purchases fell by nearly two-thirds from 2021 to 2025 amid soaring prices and mortgage rates
Source: SellMyTimeshareNow analysis of FFIEC’s Home Mortgage Disclosure Act data | Image Credit: SellMyTimeshareNow
The U.S. vacation-home market has contracted sharply since its pandemic-era peak, reversing a surge driven by historically low borrowing costs and increased demand for remote-friendly living. Vacation-home purchases using a mortgage fell from 257,549 units in 2021 to just 88,158 in 2025, a decline of 65.8%. Similarly, the vacation-home share of total mortgage originations fell from 4.9% in 2021 to 2.6% in 2025. These drops followed a period when second-home demand expanded rapidly, particularly in resort markets and lower-density areas.
The decline aligns with a rapid deterioration in affordability. Mortgage rates rose significantly from pandemic-era lows, increasing borrowing costs and reducing purchasing power, even for higher-income households that typically drive second-home demand. At the same time, home prices in the U.S.—including many vacation-oriented markets—remained elevated, limiting the ability of buyers to re-enter the market after the initial pandemic surge. Taken together, these conditions appear to have significantly reduced the pool of buyers able or willing to purchase vacation homes outright. The scale and speed of the decline suggest that the vacation home segment—often more sensitive to financial conditions than primary housing—has been particularly affected by the post-pandemic economic conditions.
How Has the U.S. Timeshare Industry Fared in the Post-Pandemic Economy?
Despite persistent inflation, U.S. timeshare sales volume and rental revenues have both more than doubled since their 2020 lows
Source: SellMyTimeshareNow analysis of ARDA’s 2025 State of the Vacation Timeshare Industry data | Image Credit: SellMyTimeshareNow
While demand for traditional vacation homes has weakened, the U.S. timeshare industry has followed a markedly different path since the pandemic downturn. Data from the American Resort Development Association indicates that timeshare sales volume reached lows of $4.9 billion in 2020, while timeshare rental revenue was just $1.3 billion, reflecting the sharp disruption to leisure travel during the first year of the pandemic.
The industry recovered quickly in the years that followed. By 2024, timeshare sales had risen to $10.5 billion, up 114.3% from its 2020 low, while rental revenue increased to $3.2 billion, a gain of 146.2%. That rebound suggests that even as inflation and higher interest rates have made large real estate purchases more difficult, many consumers have continued to spend on vacation access through ownership models that typically require less long-term financial commitment than buying a second home outright.
What Are the Most Popular Destinations to Buy a Timeshare?
While Mexico and Aruba lead international interest, the U.S. dominates timeshare purchase offer volumes—driven by Florida, Hawaii, and Nevada
Source: SellMyTimeshareNow marketplace data | Image Credit: SellMyTimeshareNow
Despite broad growth in timeshare sales and rental activity, demand for timeshare ownership remains highly concentrated in a relatively small group of destination countries. On the SellMyTimeshareNow marketplace in 2025, the United States recorded the highest number of timeshare purchase offers by far at 14,942, with Mexico ranking a distant second at 3,373, followed by Aruba at 1,598. Other international markets saw significantly lower levels of activity, including Canada (398), the Netherlands Antilles (274), and Australia (258), indicating that interest is largely focused on a handful of established resort destinations.
Within the United States, activity was led by Florida with 3,506 offers, followed by Hawaii (2,219) and Nevada (1,755). A second tier of states—including California (1,284), South Carolina (1,156), and Colorado (1,063)—also recorded notable activity, though at lower levels. The concentration of demand in these markets reflects the role of established tourism infrastructure and consistent visitor demand in sustaining timeshare interest.
Where Are Vacation Home Purchases Declining the Most?
Florida led the U.S. with over 38,000 fewer vacation home purchases, but Nevada, Hawaii, and Wyoming saw the sharpest percentage declines
Source: SellMyTimeshareNow analysis of FFIEC’s Home Mortgage Disclosure Act data | Image Credit: SellMyTimeshareNow
Many of the same states that lead in timeshare demand also appear to be among those experiencing the sharpest pullbacks in traditional vacation-home purchases, pointing to a broader shift in how consumers access vacation properties. The decline in second-home buying has been widespread across the United States, though the scale and intensity vary significantly by state. In absolute terms, Florida recorded the largest decrease, with 38,465 fewer vacation-home purchases with a mortgage between 2021 and 2025, reflecting its outsized role in the second-home market during the pandemic-era surge.
Other high-volume vacation-home states also saw substantial declines in raw numbers. California recorded 13,516 fewer purchases, while Texas and North Carolina posted declines of 9,900 and 9,575, respectively. These figures suggest that states with the largest second-home markets during the pandemic boom have experienced the most pronounced pullbacks in absolute terms.
However, the steepest declines on a percentage basis were concentrated in smaller, tourism-dependent states—several of which also rank among the top timeshare destinations. Nevada saw the sharpest drop, with vacation-home purchases falling by 78.3%, followed by Hawaii (-77.8%) and Wyoming (-74.5%). These sharper contractions indicate that, in some destination markets, demand has fallen back more dramatically relative to its pandemic peak, underscoring the sensitivity of these regions to shifts in affordability and discretionary spending.
At the metro level, the sharpest declines were widespread across both large population centers and smaller destination markets. Among large metros, Austin, TX saw the steepest drop, with vacation-home purchases falling 80.4%, followed closely by major leisure markets such as Las Vegas (-79.4%), Orlando (-79.4%), and Miami (-78.8%). Similar patterns are evident in well-known vacation destinations, including Breckenridge, CO (-63.9%), Naples, FL (-76.1%), and Kahului, HI (-85.2%), all of which are heavily tied to tourism-driven housing demand. These declines suggest that even in large metropolitan areas and high-demand leisure markets alike, elevated costs and shifting consumer preferences have significantly curtailed second-home purchasing activity.
For more information about the datasets and calculations used in this analysis, see the methodology section. For complete results, see U.S. Cities Where Vacation Home Demand Has Declined the Most on SellMyTimeshareNow.
Methodology

Photo Credit: Mark Winfrey / Shutterstock
To determine the locations where vacation home demand has declined the most, researchers at SellMyTimeshareNow analyzed the latest data from the Federal Financial Institutions Examination Council’s 2025 Home Mortgage Disclosure Act, the U.S. Census Bureau’s 2024 American Community Survey, and SellMyTimeshareNow’s 2025 proprietary marketplace data. The researchers ranked locations according to the percentage change in second-home mortgages from 2021 to 2025. Vacation homes were considered to be those with an occupancy type of “second residence”, and only originated home-purchase mortgages were included. Vacation homes purchased without a mortgage—and therefore not subject to HMDA reporting—are not reflected in the analysis.
In the event of a tie, the location with the larger total decline in second-home mortgages was ranked higher. For context, researchers also calculated the second-home share of total mortgage originations in 2025, the median value of mortgaged second homes in 2025, and the share of housing used for seasonal, recreational, or occasional use.
To improve relevance, only records with complete data were included in the analysis, and metro areas—which include both metropolitan and micropolitan areas—were grouped into the following cohorts based on population size:
- Large metros: 1,000,000 or more
- Midsize metros: 350,000–999,999
- Small metros: 100,000–349,999
- Extra small metros: less than 100,000
For complete results, see U.S. Cities Where Vacation Home Demand Has Declined the Most on SellMyTimeshareNow.